Home Page
User Interface Overview
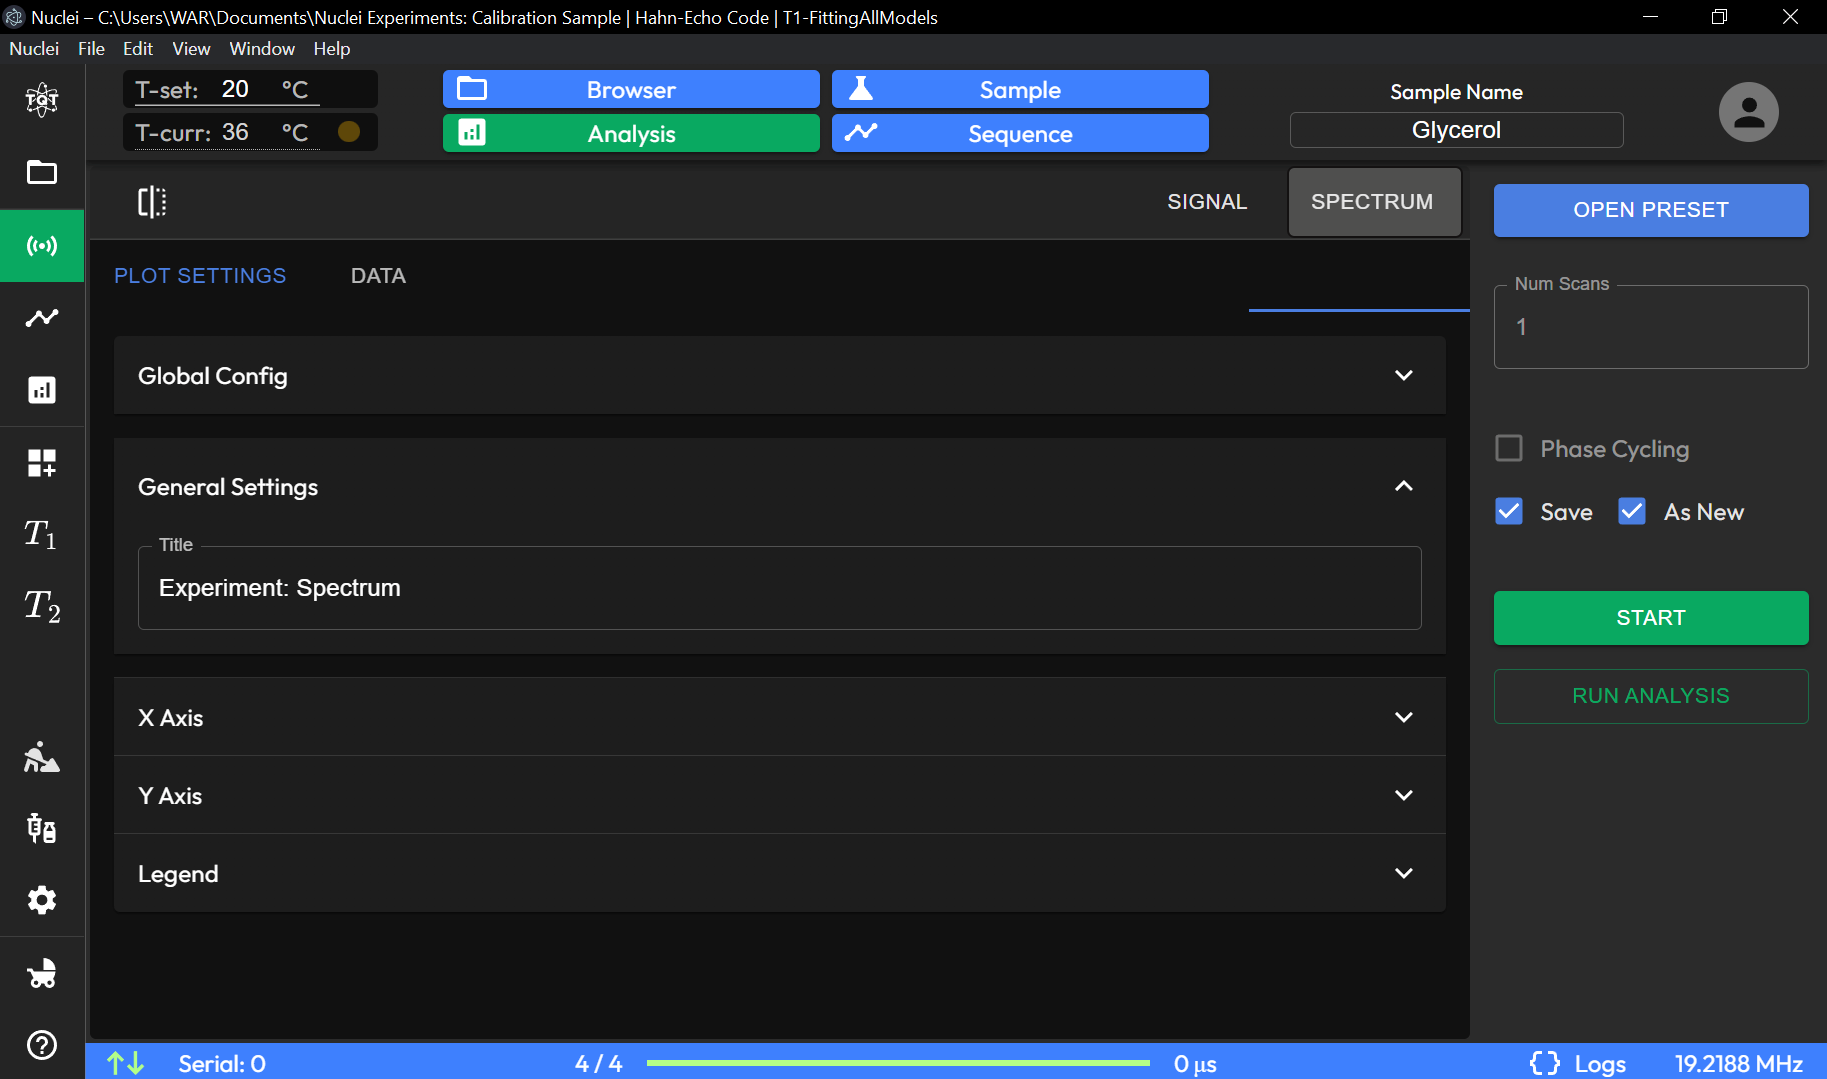
This section provides an overview of the interface, describing each button, field, and option available on the screen.
See basic information how to set-up your NMR device at Device Setup.
Temperature Display
T-set (°C): Displays the target temperature setting for the experiment in degrees Celsius.
T-curr (°C): Shows the current temperature in degrees Celsius.
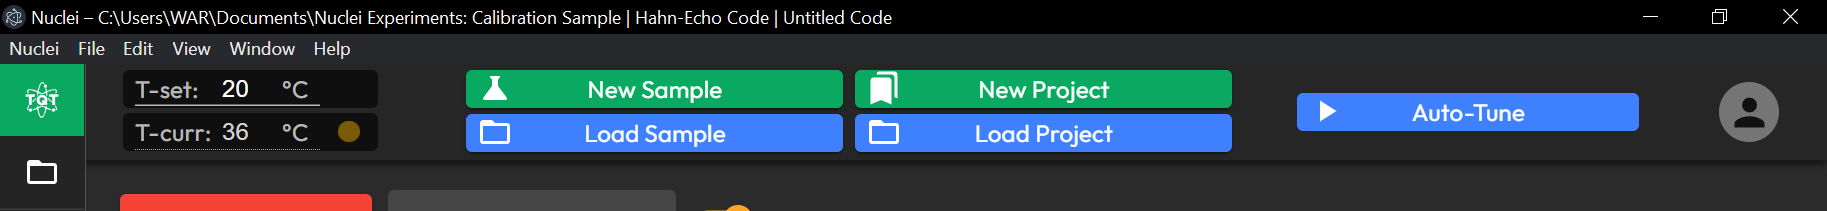
Sample and Project Controls
New Sample: Opens a dialog to create a new sample file for the experiment.
Load Sample: Opens a dialog to load an existing sample file.
New Project: Creates a new project for managing multiple sample files and experiments.
Load Project: Loads an existing project file.
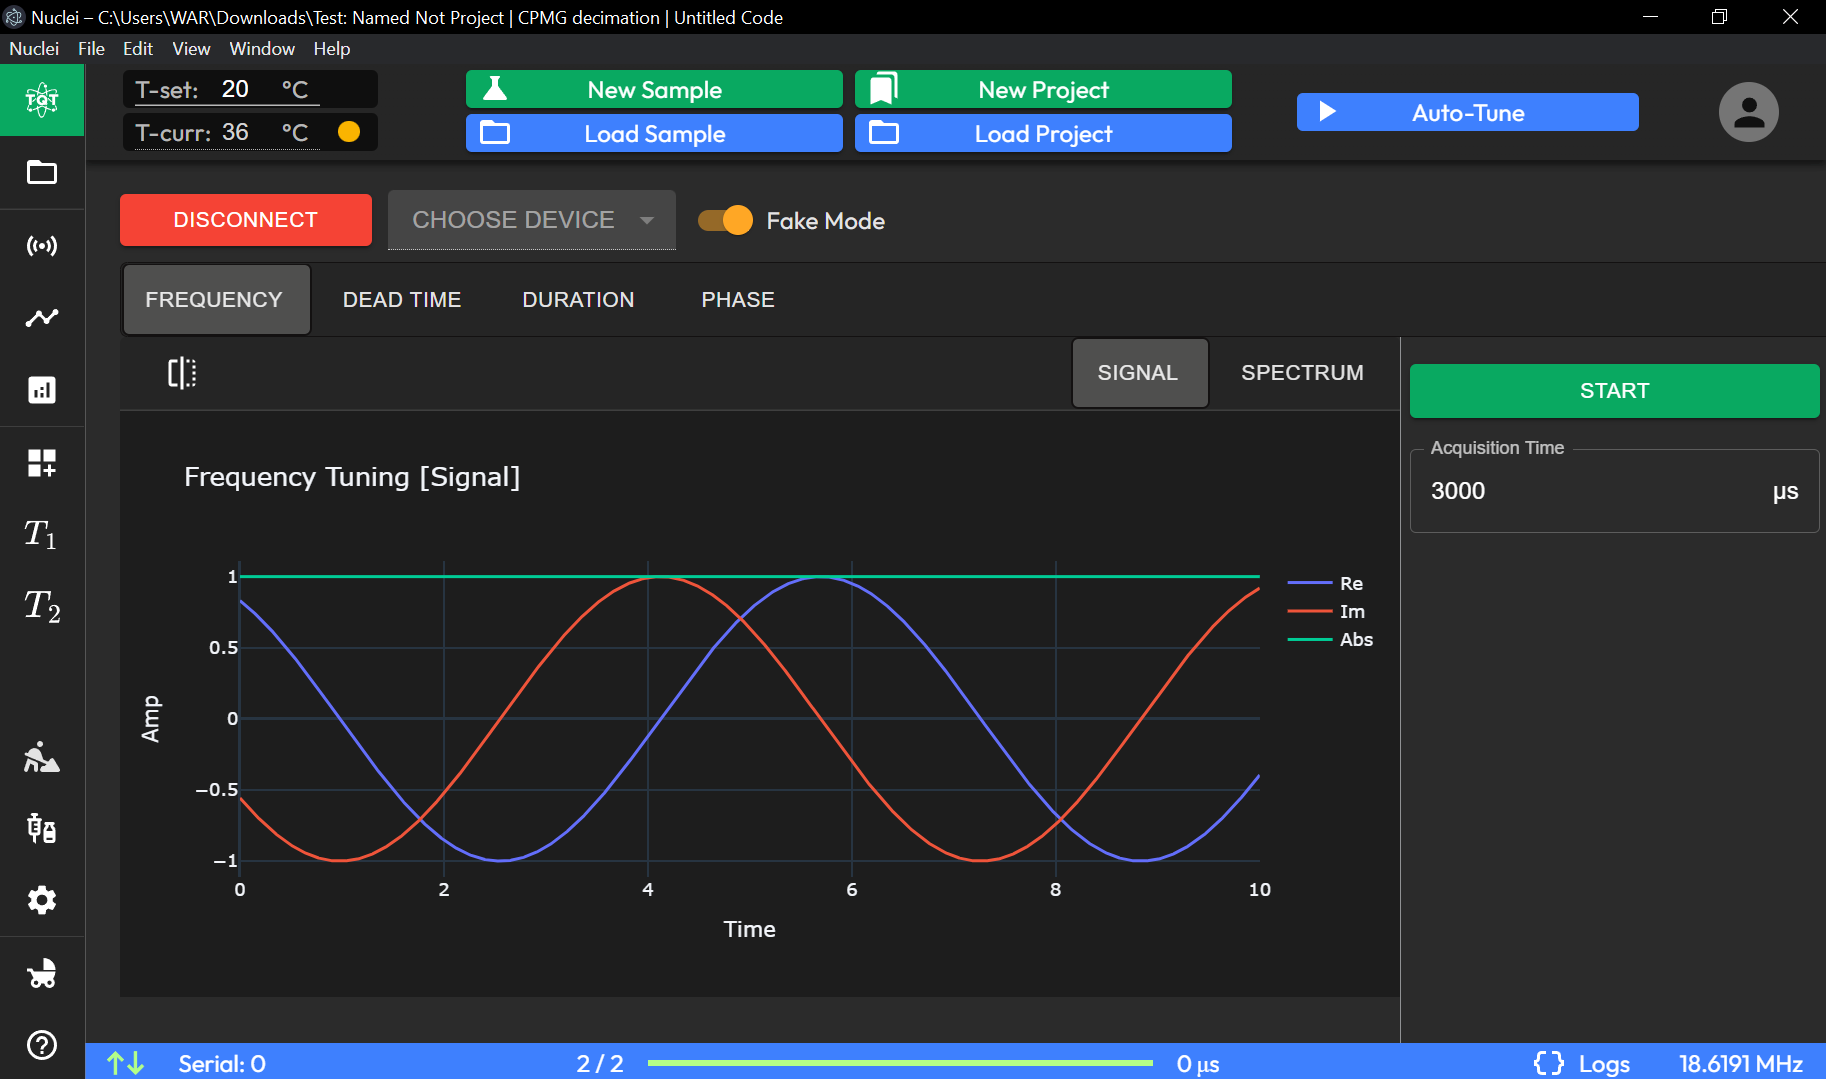
Device Connection Controls

DISCONNECT: Disconnects the currently connected device.
CHOOSE DEVICE: Allows you to select the device to connect to.
Fake Mode (Toggle): Enables or disables fake mode for testing without connecting to a real device.
Tuning Tabs
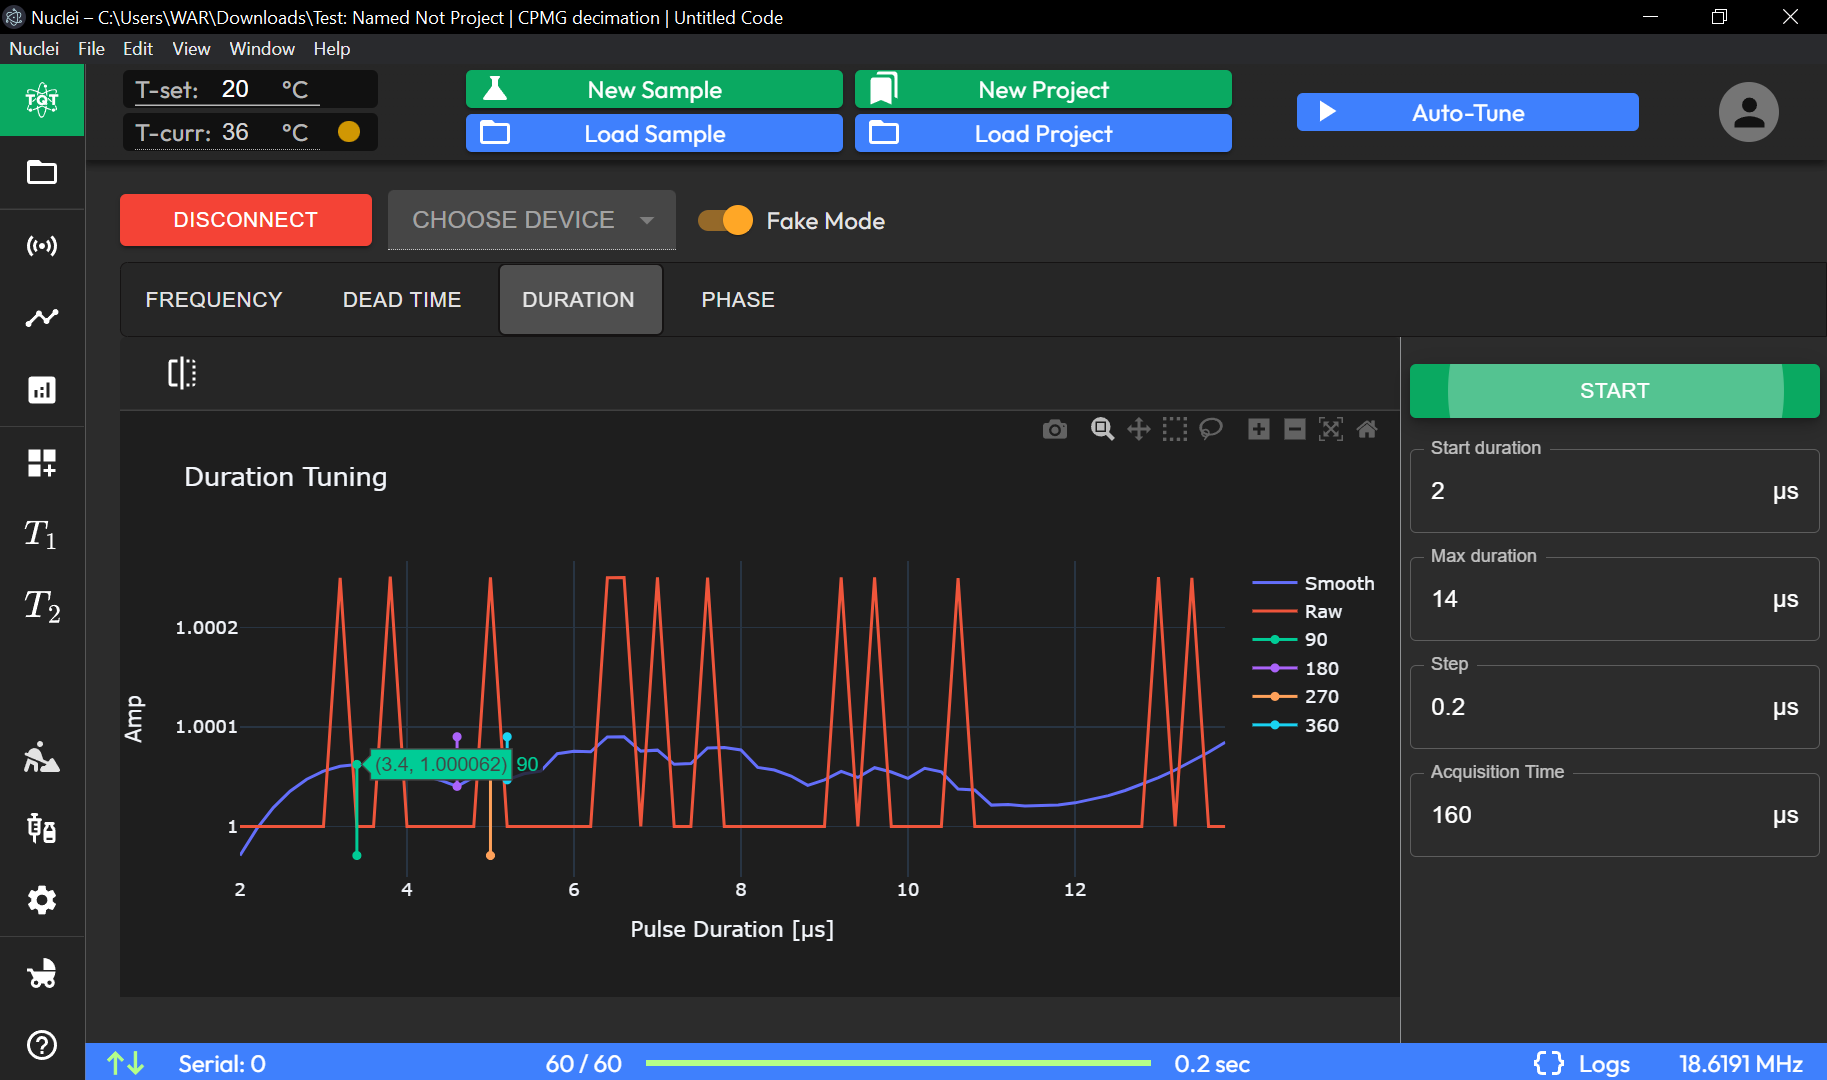
Graphical Display
Duration Tuning Graph: Shows a plot of amplitude versus pulse duration. Different colors represent various angle settings (90°, 180°, 270°, 360°).
Experiment Control Panel
START Button: Initiates the experiment with the selected parameters.
Start Duration: Sets the starting pulse duration in microseconds (µs).
Max Duration: Specifies the maximum pulse duration in microseconds (µs).
Step: Defines the increment for each pulse duration step in microseconds (µs).
Acquisition Time: Sets the total acquisition time for the experiment in microseconds (µs).
Status Bar

Serial: Displays the status of the serial connection.
Progress Bar (4/4): Indicates the current step out of the total steps in the experiment.
Elapsed Time Display (0 µs): Shows the time elapsed since the start of the experiment.
Logs: Accesses the log file for detailed information on the experiment’s progress.
Frequency Display (19.2188 MHz): Displays the current frequency setting.
Navigation Menu (Left Sidebar)
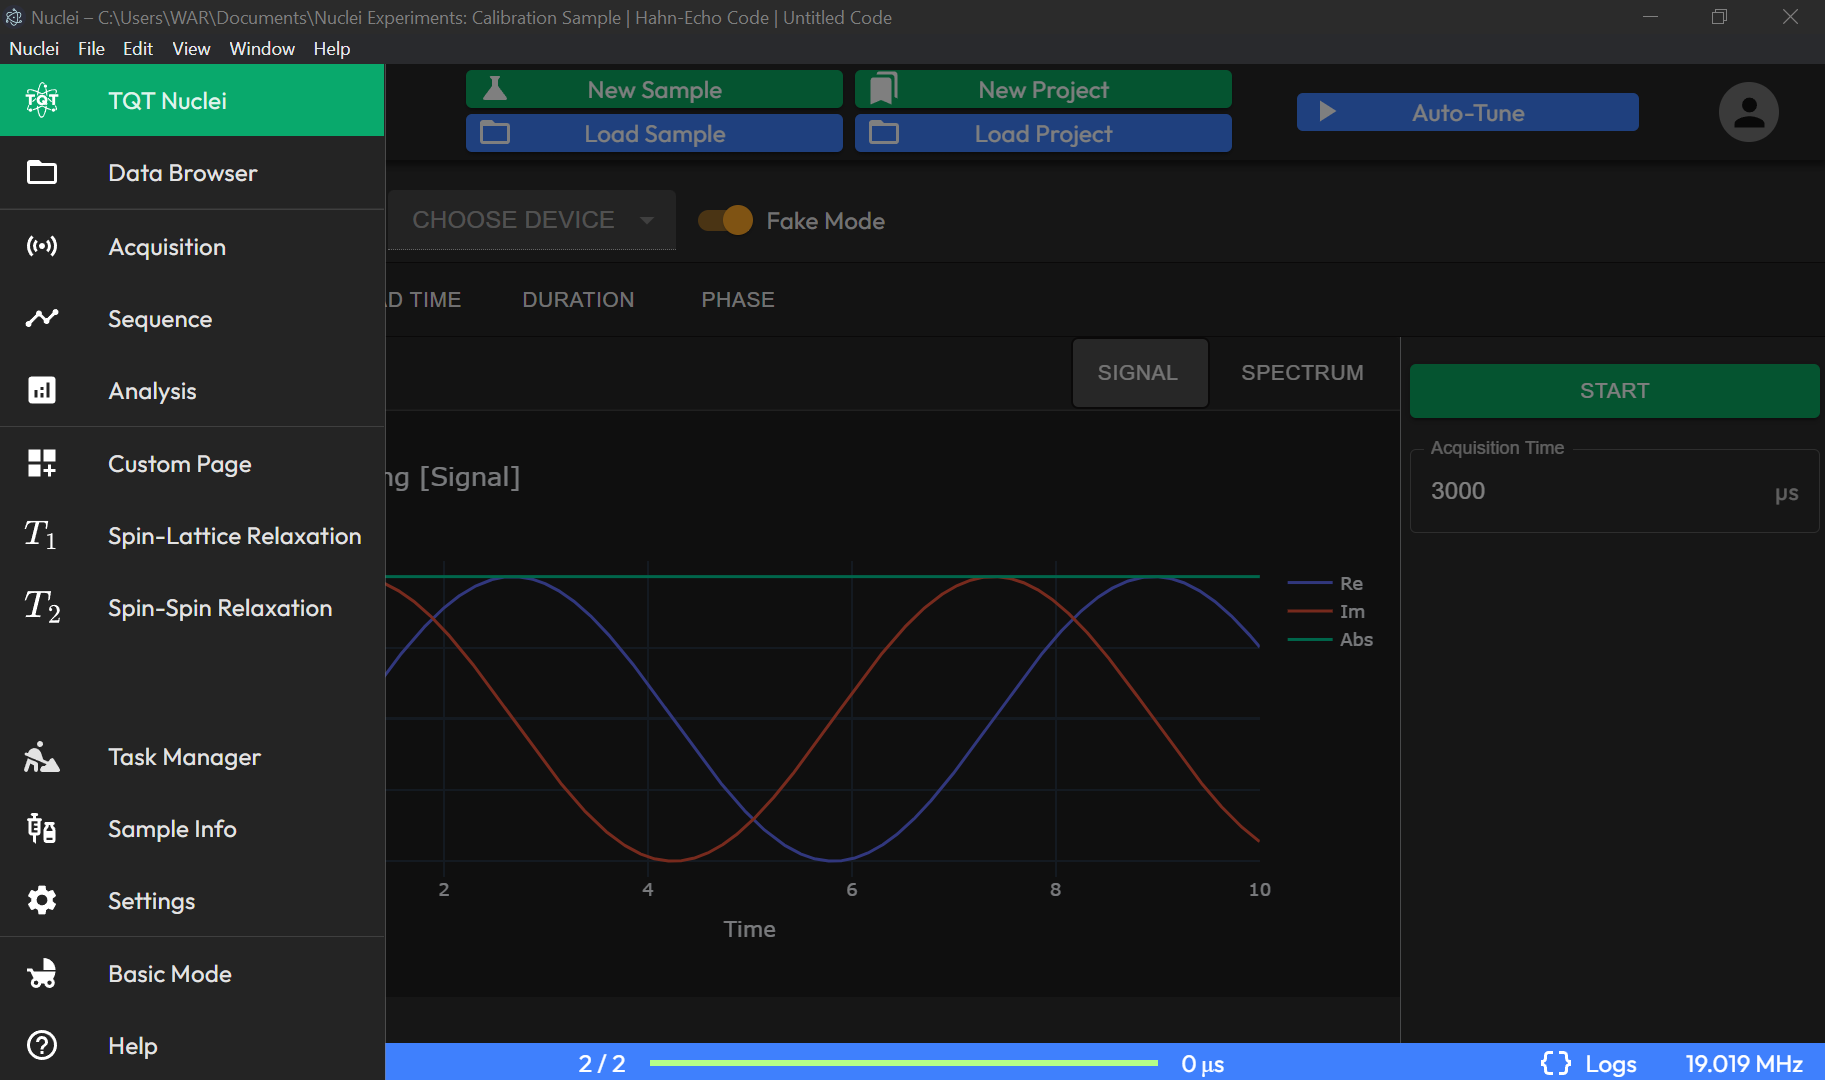
- Icons:
Various icons on the left sidebar allow navigation to different sections, such as experiment management, settings, and device configuration. Icons represent:
Acquisition
Sequence
Others
Each button and field on this interface provides a specific function to facilitate efficient management of NMR experiments. The intuitive design helps streamline the experimental process, from setting parameters to monitoring real-time results.
Phase Tuning
The Phase Tuning section allows you to adjust the phase angle for optimal signal response.
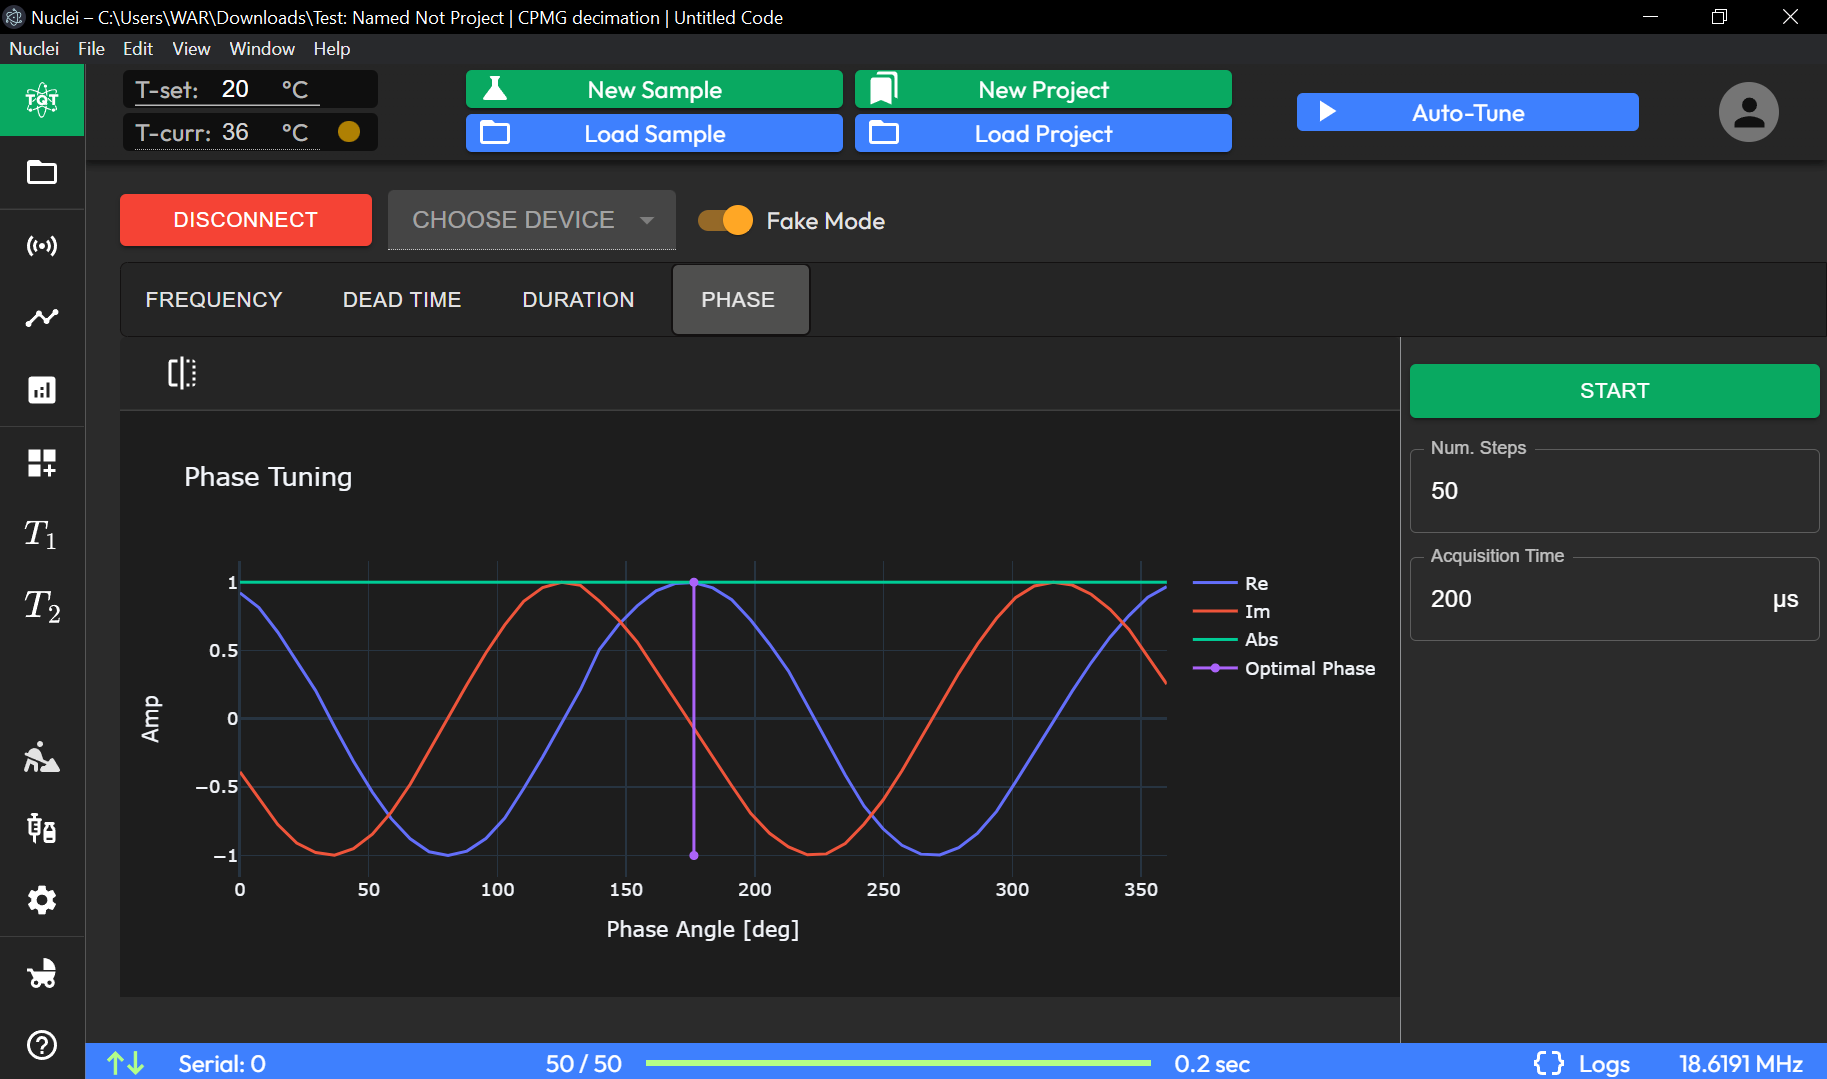
Phase Tuning Graph:
Plots amplitude (Amp) against phase angle (degrees).
The line labeled as “Optimal Phase” indicates the phase angle setting that provides the best signal.
Experiment Control Panel (Specific to Phase Tuning)
Num. Steps: Sets the number of phase angle steps to scan through during tuning.
Acquisition Time: Specifies the acquisition time for the phase tuning experiment in microseconds (µs).
This section is dedicated to finding the phase angle that optimizes signal response. Adjust the Num. Steps and Acquisition Time as required before starting the phase tuning process.
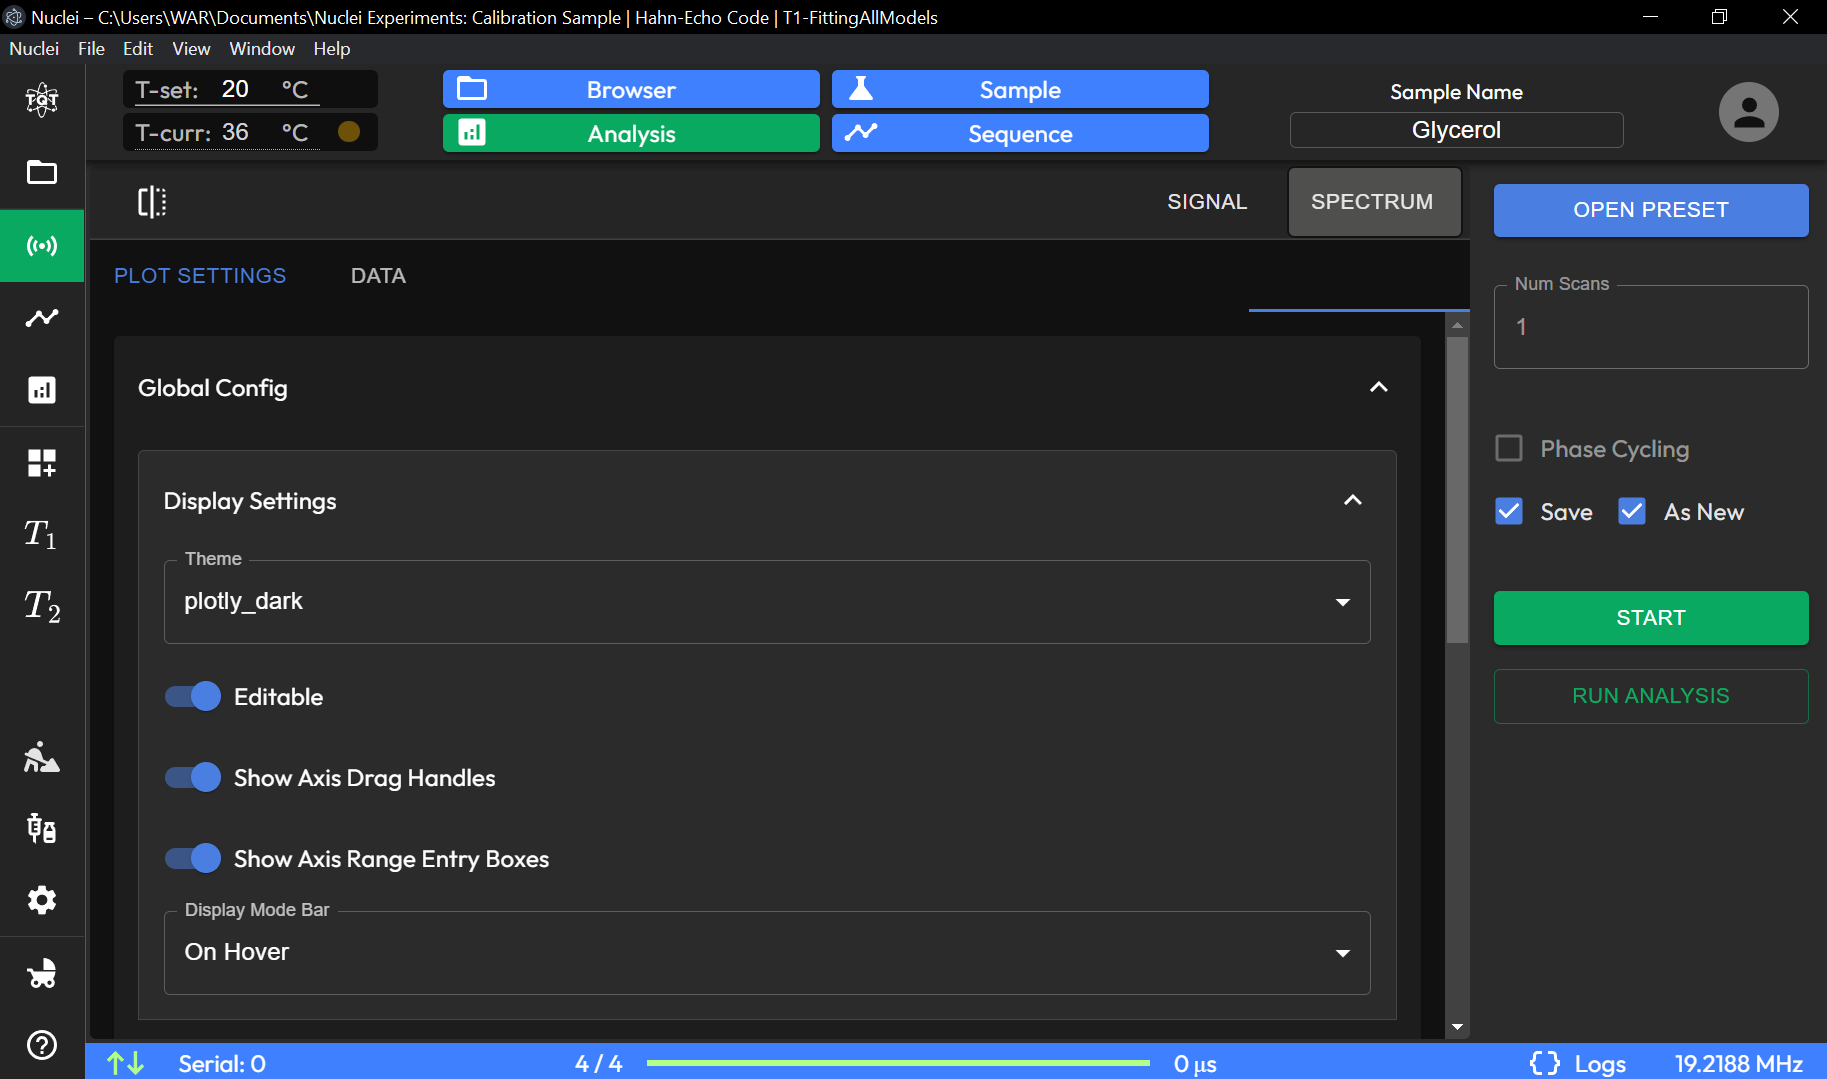
Experiment Data Preview Toggle
The Preview Experiment section allows you to manage and visualize experiment data.
The Experiment Data Preview Toggle submenu allows users to fully customize the visual appearance and presentation of data from any plot component in TQT Nuclei. This powerful tool offers a variety of options for adjusting how experimental results are displayed, providing flexibility for both data analysis and presentation. Additionally, it allows users to download the raw data directly from the plot for further processing. Below are the key customization options available in this submenu:
Plot Theme
Users can change the overall theme of the plot, selecting from several predefined themes. This option adjusts the background color, grid style, and overall aesthetics of the plot to suit different preferences or presentation needs.
Graph Title and Axes Labels
Title: Users can easily change the title of the graph to better reflect the nature of the data or the experiment.
Axes: The x-axis and y-axis labels can be edited to provide more context, such as units of measurement or descriptive labels for the plotted variables.
Legend
The legend can also be customized in the submenu. Users can:
Change the position of the legend on the plot.
Edit the labels of each data series to make them more descriptive.
Toggle the legend’s visibility on or off.
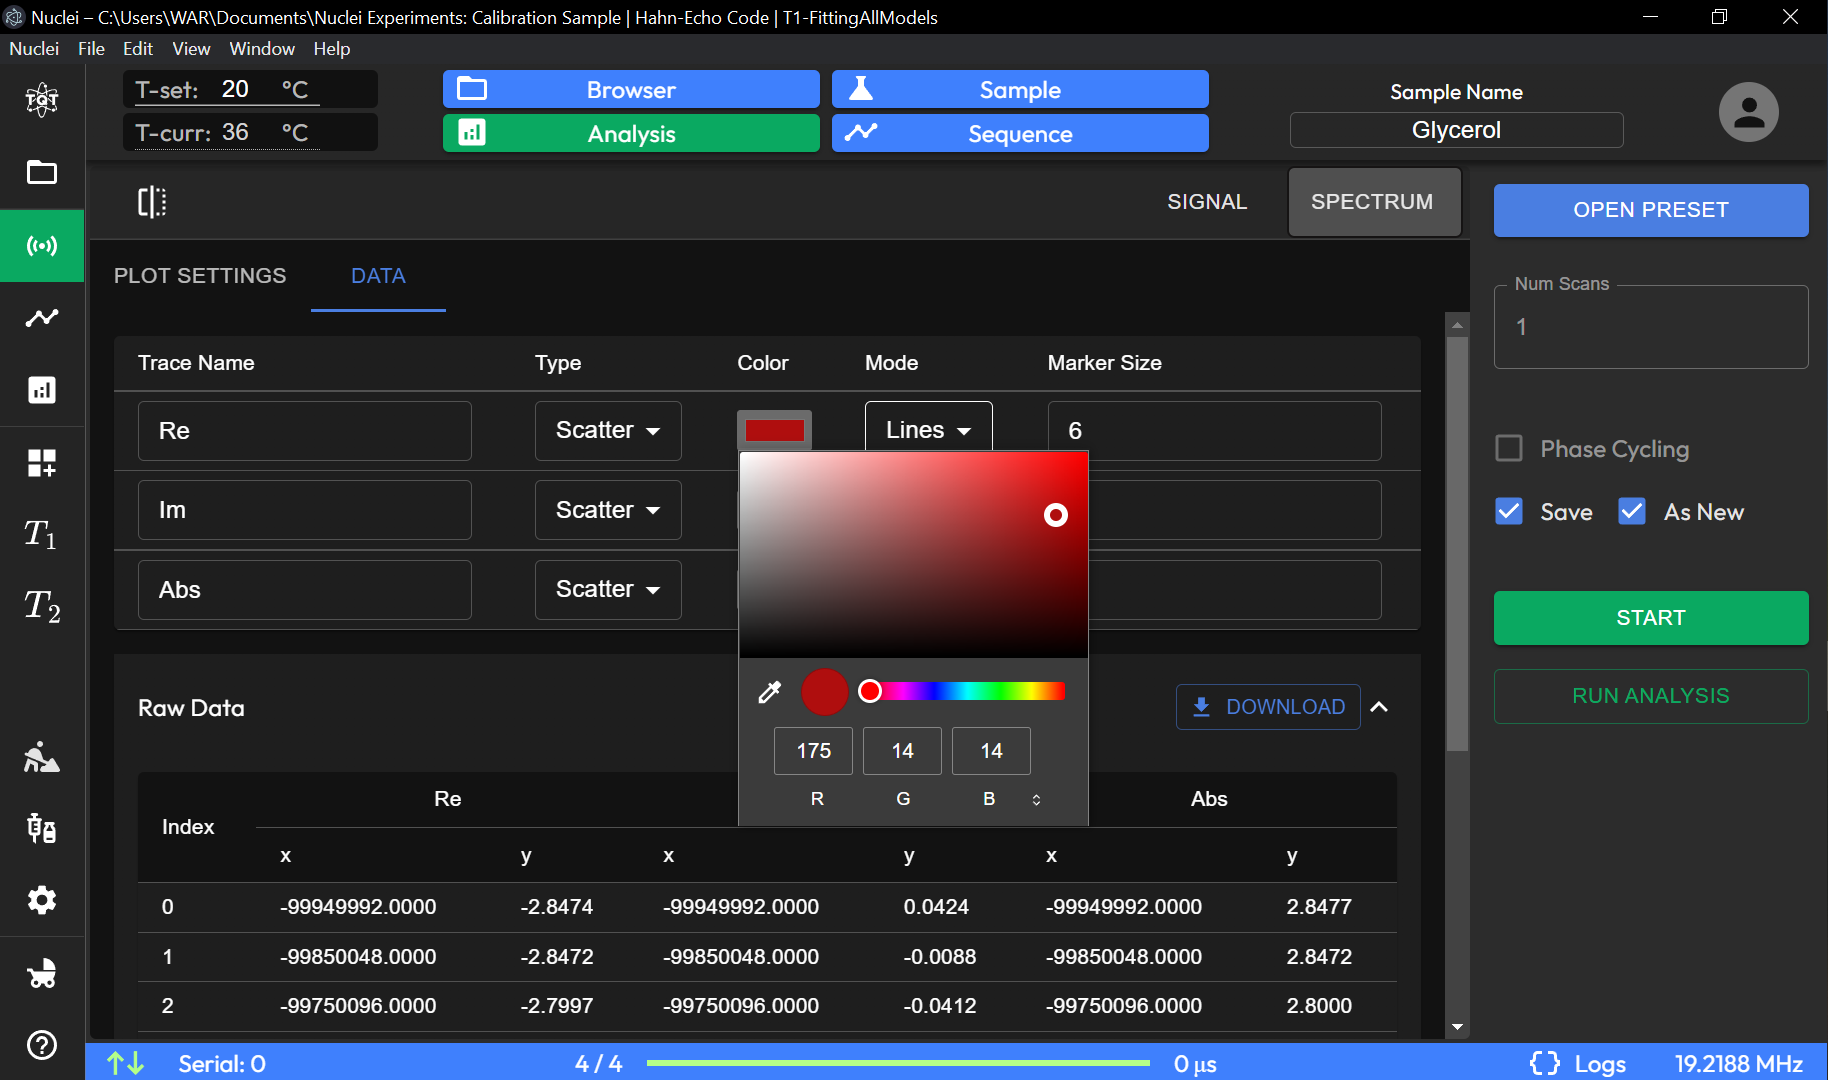
Signal Line Color
Each signal line on the plot can be customized with a unique color.
The native color palette offers a range of distinct colors, allowing users to visually separate different data series for easier comparison and interpretation.
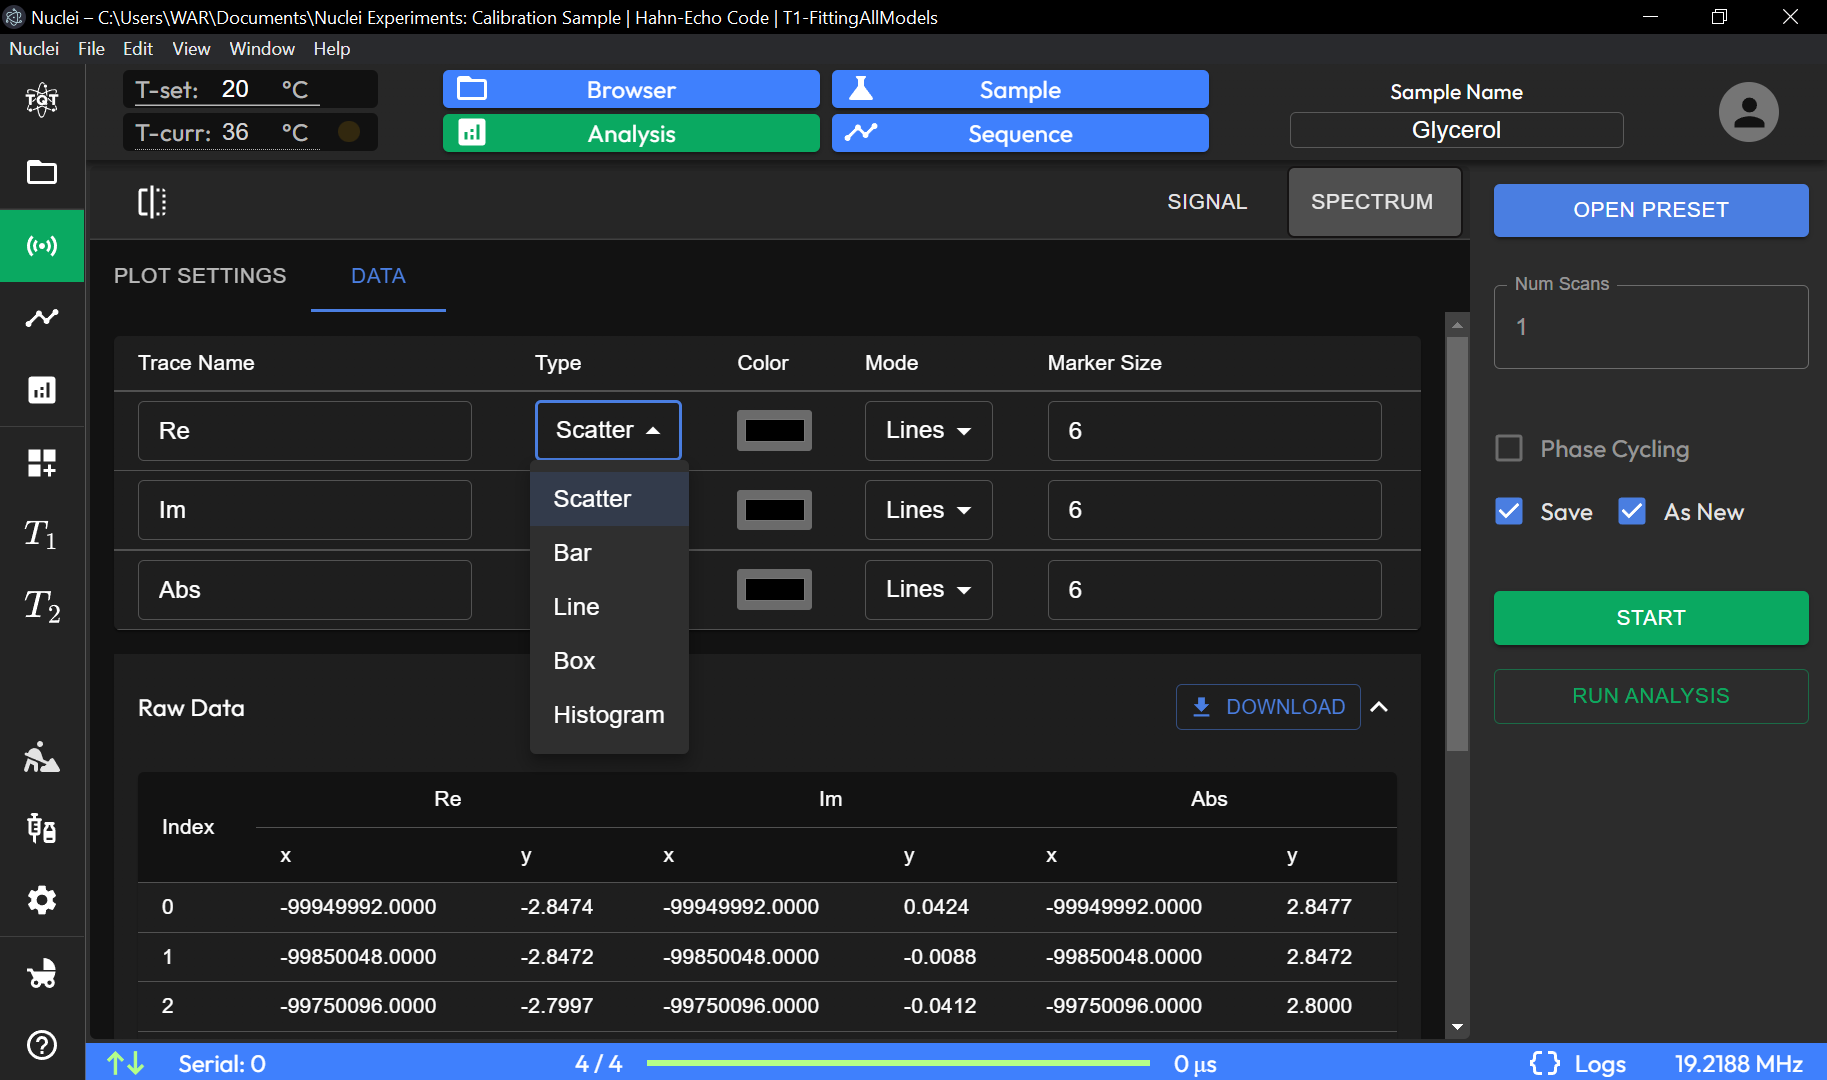
Data Point Rendering
The submenu allows users to choose how data points are rendered on the plot:
Scatter Plot: Displays individual data points as markers.
Line Plot: Connects the data points with lines, providing a continuous visual representation of the data.
Histogram: Displays the distribution of data in bar format.
Combined Renderings: Users can combine different rendering styles, such as scatter and line plots, for more detailed visual analysis.
Download Raw Data
For further analysis or reporting, users can download the raw data from the current plot directly via the Download Raw Data option. This exports the data in a standard format, such as CSV, allowing users to analyze or manipulate the data in external tools.
These customization options make the Experiment Data Preview Toggle submenu a powerful tool for personalizing data visualizations and enhancing both data analysis and presentation within the TQT Nuclei software.