Analysis
The Analysis page provides a code editor specifically for analyzing previously acquired data, without performing new data acquisition.
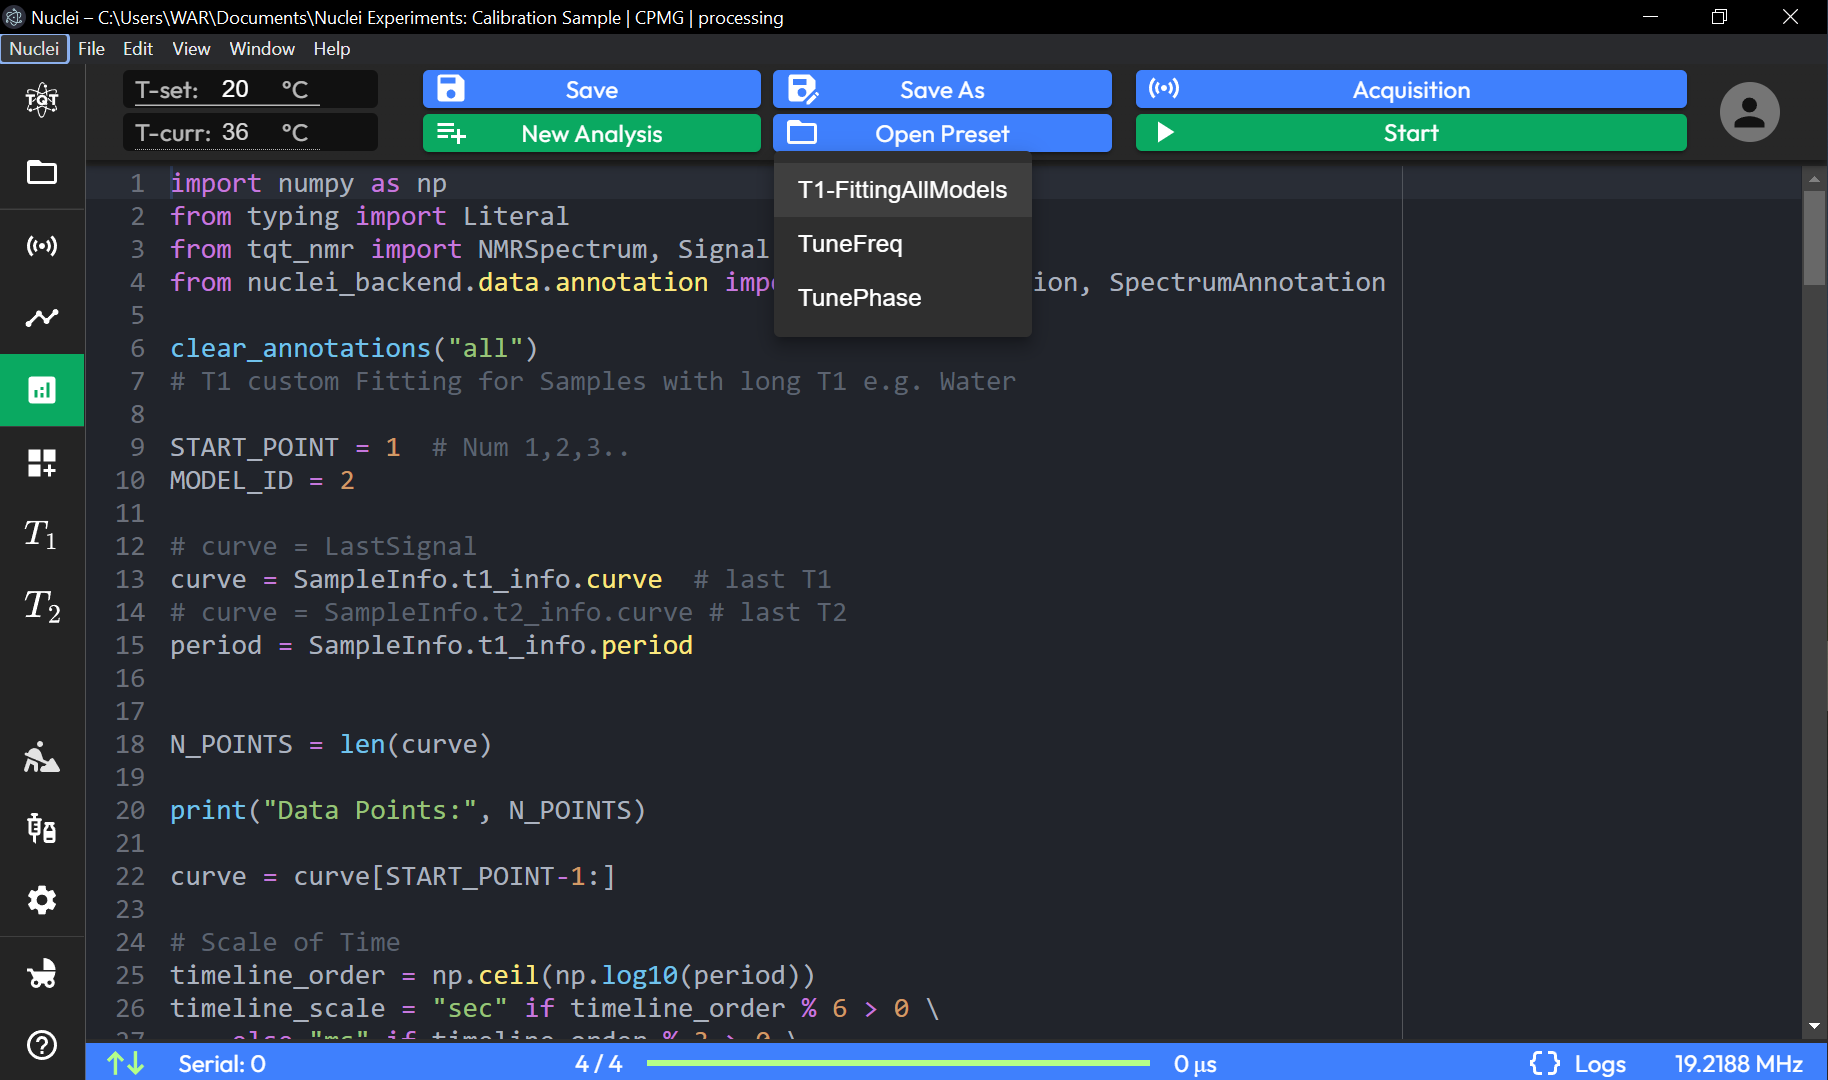
Code Editor (Analysis Script)
Script-Based Analysis: The code editor allows users to write or modify scripts for analyzing captured data, such as fitting or processing NMR signals.
Users can import necessary libraries and modules, like
numpy,NMRSpectrum, andSignalAnnotation, to facilitate data analysis.The script can include parameters like:
START_POINT: Specifies the starting point for analysis, allowing users to select specific data segments.
MODEL_ID: Identifies the model used for fitting or analysis, enabling customized fitting algorithms.
Internal and External function calls (for further information see Namespaces).
Analysis-Specific Functions
Data Access: The script can retrieve data from specific variables, such as
SampleInfo.t1_info.curve, which represents the curve for T1 analysis.Data Manipulation: Users can process data by specifying variables and modifying data points within the script, such as scaling time or adjusting the number of data points.
Annotation Functions: Provides options for clearing or adding annotations (e.g.,
clear_annotations("all")) to the analysis graph for improved data interpretation.
Control Options
Save, Save As, Save Preset: Options to save the current analysis script, either by overwriting, saving as a new file, or saving as a preset for future use.
New, Open, Open Preset: Allows creating a new analysis script or opening an existing one, including presets for quick access.
Acquisition (Disabled): The acquisition button is available but intended only for switching between modes, as new data acquisition does not occur on this page.
Start (Playback): Initiates the execution of the analysis script on the loaded dataset.
The Analysis page enables users to execute custom analysis scripts on previously captured data, facilitating detailed examination and processing without requiring re-acquisition. It’s ideal for users who wish to perform data fitting, modeling, or specific signal evaluations post-capture.
Preset Examples
 1    # ----------- Settings -----------
 2
 3    ACQ_TIME = 3000
 4
 5    SEQUENCE = [
 6        Pulse("x+", 3.6),
 7        Silence(11),
 8        ADC(ACQ_TIME)
 9    ]
10
11    # ----------- Tune -----------
12
13    _, spectrum = run_sequence(SEQUENCE)
14
15    shift_mhz = spectrum.frequencies[spectrum.amplitudes.real.argmax()]
16    shift_hz = shift_mhz / 1e6
17
18    tuned_freq = DeviceSettings.frequency + shift_hz
19    print("New Frequency:", tuned_freq)
20
21    DeviceSettings.frequency = tuned_freq
 1    import numpy as np
 2    from tqt_nmr import Signal
 3
 4    # ----------- Settings -----------
 5
 6    NUM_STEPS = 50
 7
 8    ECHO_TIME = 200
 9    RING_TIME = 11
10    START_SLEEP = 2
11
12
13    BASE_PHASE = 90.0
14    MAX_PHASE_ANGLE = 360
15
16    SEQUENCE = [
17        Silence(START_SLEEP),
18        Pulse("x+", DeviceSettings.p90_us),
19        Silence(RING_TIME),
20        ADC(ECHO_TIME),
21        Silence(START_SLEEP),
22    ]
23
24    # ----------- Single Iteration -----------
25
26
27    def tune_iteration(phase_angle: float) -> tuple[float, float]:
28        DeviceSettings.phase_deg = phase_angle
29
30        acq_start_time = START_SLEEP + RING_TIME + DeviceSettings.p90_us
31        signal, _ = run_sequence(SEQUENCE, seq_null=acq_start_time)
32
33        mean_real = -np.mean(signal.amplitudes[4:11].real)
34        mean_imag = -np.mean(signal.amplitudes[4:11].imag)
35
36        return mean_real, mean_imag
37
38
39    # ----------- Full Process -----------
40
41    phase_angles = np.linspace(0, MAX_PHASE_ANGLE, NUM_STEPS)
42    amplitudes = []
43
44    for i, phase_angle in enumerate(phase_angles):
45        print(f"{i + 1} / {len(phase_angles)}")
46        mean_real, mean_imag = tune_iteration(phase_angle)
47
48        amplitudes.append(mean_real + 1j * mean_imag)
49
50        plot(Signal(phase_angles[: i + 1], np.array(amplitudes)))
51
52
53    opt_phase = phase_angles[np.array(amplitudes).real.argmax()]
54    print('Optimal Phase [deg]:', opt_phase)
55
56    DeviceSettings.phase_deg = opt_phase
List of external libraries possible to import
beautifulsoup4==4.12.3
cryptography==41.0.7
Flask==3.0.2
ipython==8.28.0
Jinja2==3.1.4
jsonschema==4.17.3
matplotlib==3.9.2
nmrglue==0.9
numpy==1.26.4
pandas==2.2.3
poetry==1.8.3
pySB45 @ git@github.com:TerraQuanTech/SB45
scipy==1.13.0
SQLAlchemy==2.0.35
tqt_nmr @ git@github.com:TerraQuanTech/tqt_nmr
websockets==12.0
etc