Data Browser Page
Overview of UI Data Structure
The Data Browser page in TQT Nuclei serves as the central hub for managing and organizing your NMR experiments and projects.
This interface provides users with tools to create new experiments, modify existing projects, and review experimental data in a structured and intuitive way.
Below are the key features and components of the Data Browser page:
Creating New Experiments
The Data Browser allows users to create new experiments by entering critical information about their sample and experimental setup. When creating a new experiment, users are prompted to input:
Sample Name: A unique identifier for the sample being studied.
Laboratory Features: Users can input various environmental and sample-specific conditions, such as temperature, concentration, or other relevant experimental parameters.
Anticipated Relaxation Values: Users can specify expected values for spin-lattice relaxation time (T1) and spin-spin relaxation time (T2). These anticipated values help guide the setup and analysis of the experiment.
Managing Projects and Experiments
Root Folder Selection: Users can easily change the root folder for all NMR projects. This allows for flexible data management and organization, ensuring that different projects or experiments can be stored in appropriate directories.
Deleting Projects or Experiments: The Data Browser provides tools for deleting both entire projects and individual experiments. This feature helps users manage their workspace by removing outdated or unnecessary data.
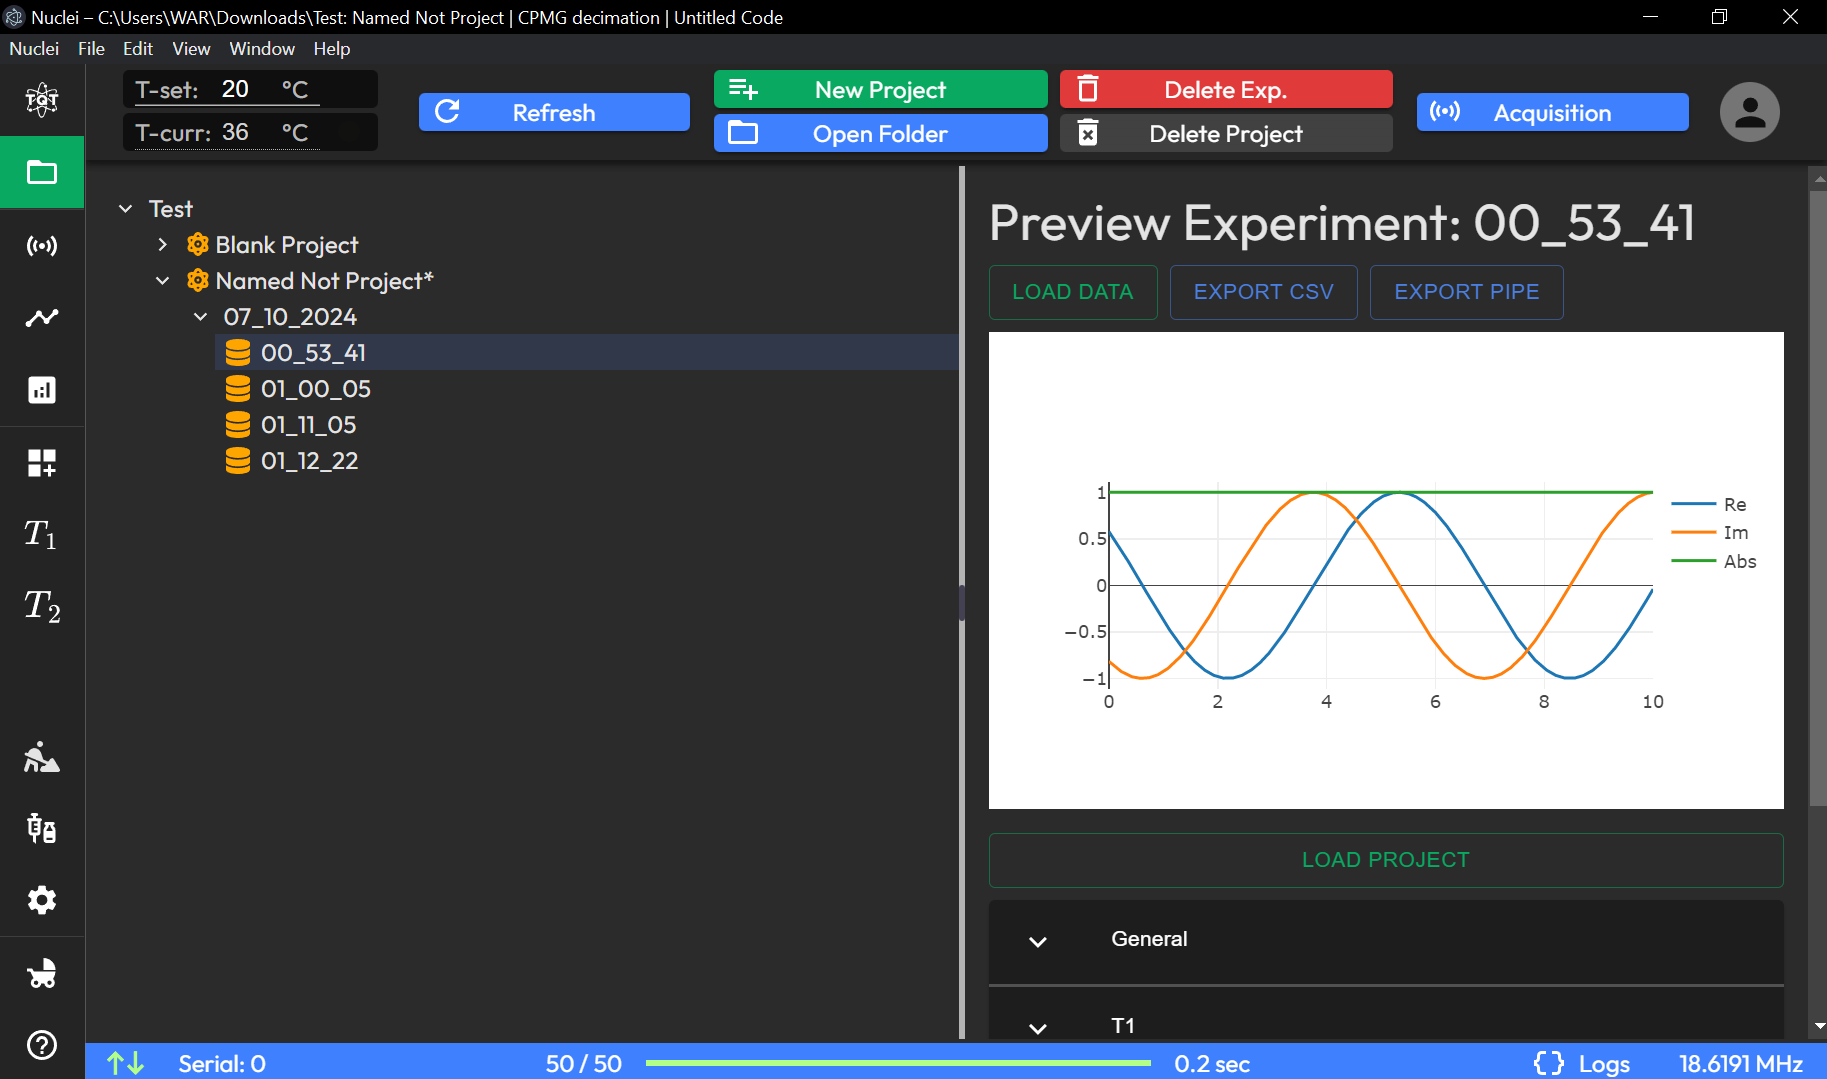
File Tree Structure
On the left side of the Data Browser interface is a file tree structure that displays the hierarchy of projects and experiments. Users can navigate through this tree to access and organize their data, similar to a traditional file manager. The structure helps keep experiments neatly categorized and easy to locate.
Data Preview Plot
To the right of the main UI space, the data preview plot provides a graphical representation of the selected experiment’s data. Users can quickly visualize the results of their NMR experiments, making it easy to identify trends or anomalies in the data without having to switch to the analysis section. The plot is fully interactive and customizable, allowing users to adjust the visualization to suit their needs.
Experiment Metadata and Setup Table
Below the data preview plot, a detailed table displays all relevant metadata and setup parameters for the selected experiment. This table includes information such as:
p90, p180 Pulse Durations
Receive (Rx) and Transmit (Tx) Amplifiers
Phase Settings
Other experimental conditions like sample properties and acquisition parameters.
This metadata is essential for documenting the experimental conditions and ensuring reproducibility.
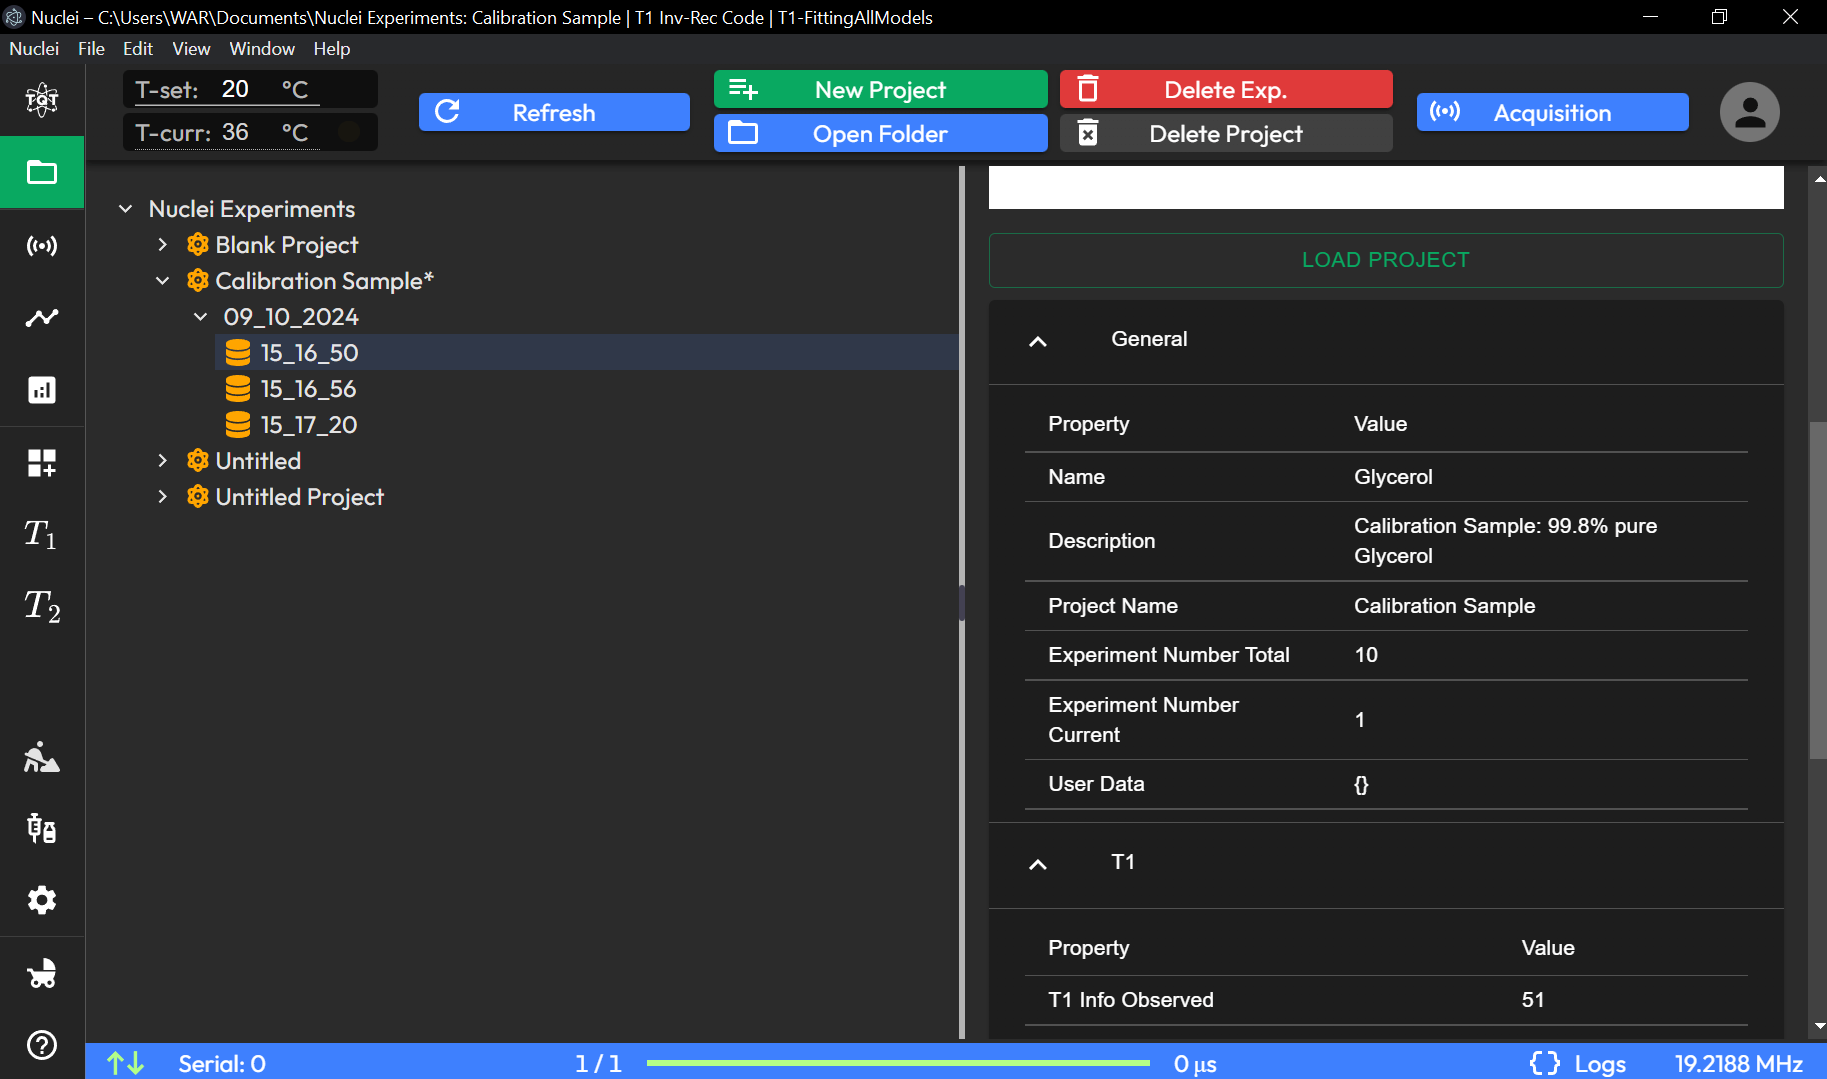
Loading and Exporting Experiments
Users can easily load a previously saved experiment by selecting it from the file tree and clicking the Load button. Additionally, the Export button allows users to save the experiment data in various formats for external analysis or sharing. This flexibility ensures that users can work with their data both inside and outside the TQT Nuclei environment.
The Data Browser page is an essential part of the TQT Nuclei workflow, providing a comprehensive set of tools for creating, managing, and reviewing experiments. With its intuitive layout, users can easily navigate through their projects, customize experiment settings, and visualize their NMR data with ease.
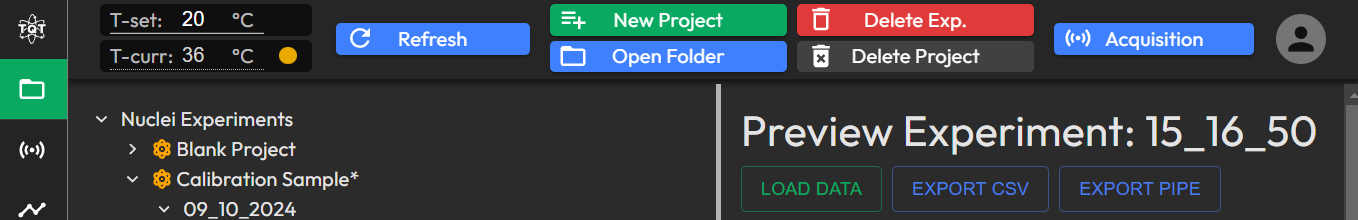
Refresh: Refreshes the list of experiments and projects.
New Project: Creates a new project for organizing experiment data.
Open Folder: Opens the folder containing the current project’s files.
Delete Exp.: Deletes the selected experiment.
Delete Project: Deletes the selected project and its associated experiments.
Sub Components Description
Experiment Data Preview
Preview Experiment: [Experiment Name]: Displays a preview of the selected experiment data with a graph. The graph includes:
Re (Real Part): Represents the real component of the signal.
Im (Imaginary Part): Represents the imaginary component of the signal.
Abs (Absolute Value): Displays the absolute value of the signal, combining real and imaginary parts.
Data Controls
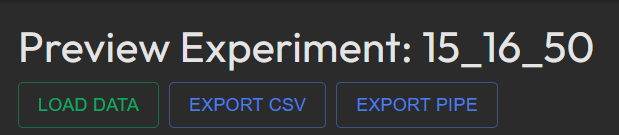
LOAD DATA: Loads data for the current experiment for further analysis.
EXPORT CSV: Exports the experiment data as a CSV file.
EXPORT PIPE: Exports the experiment data in PIPE format, suitable for specific analytical tools.
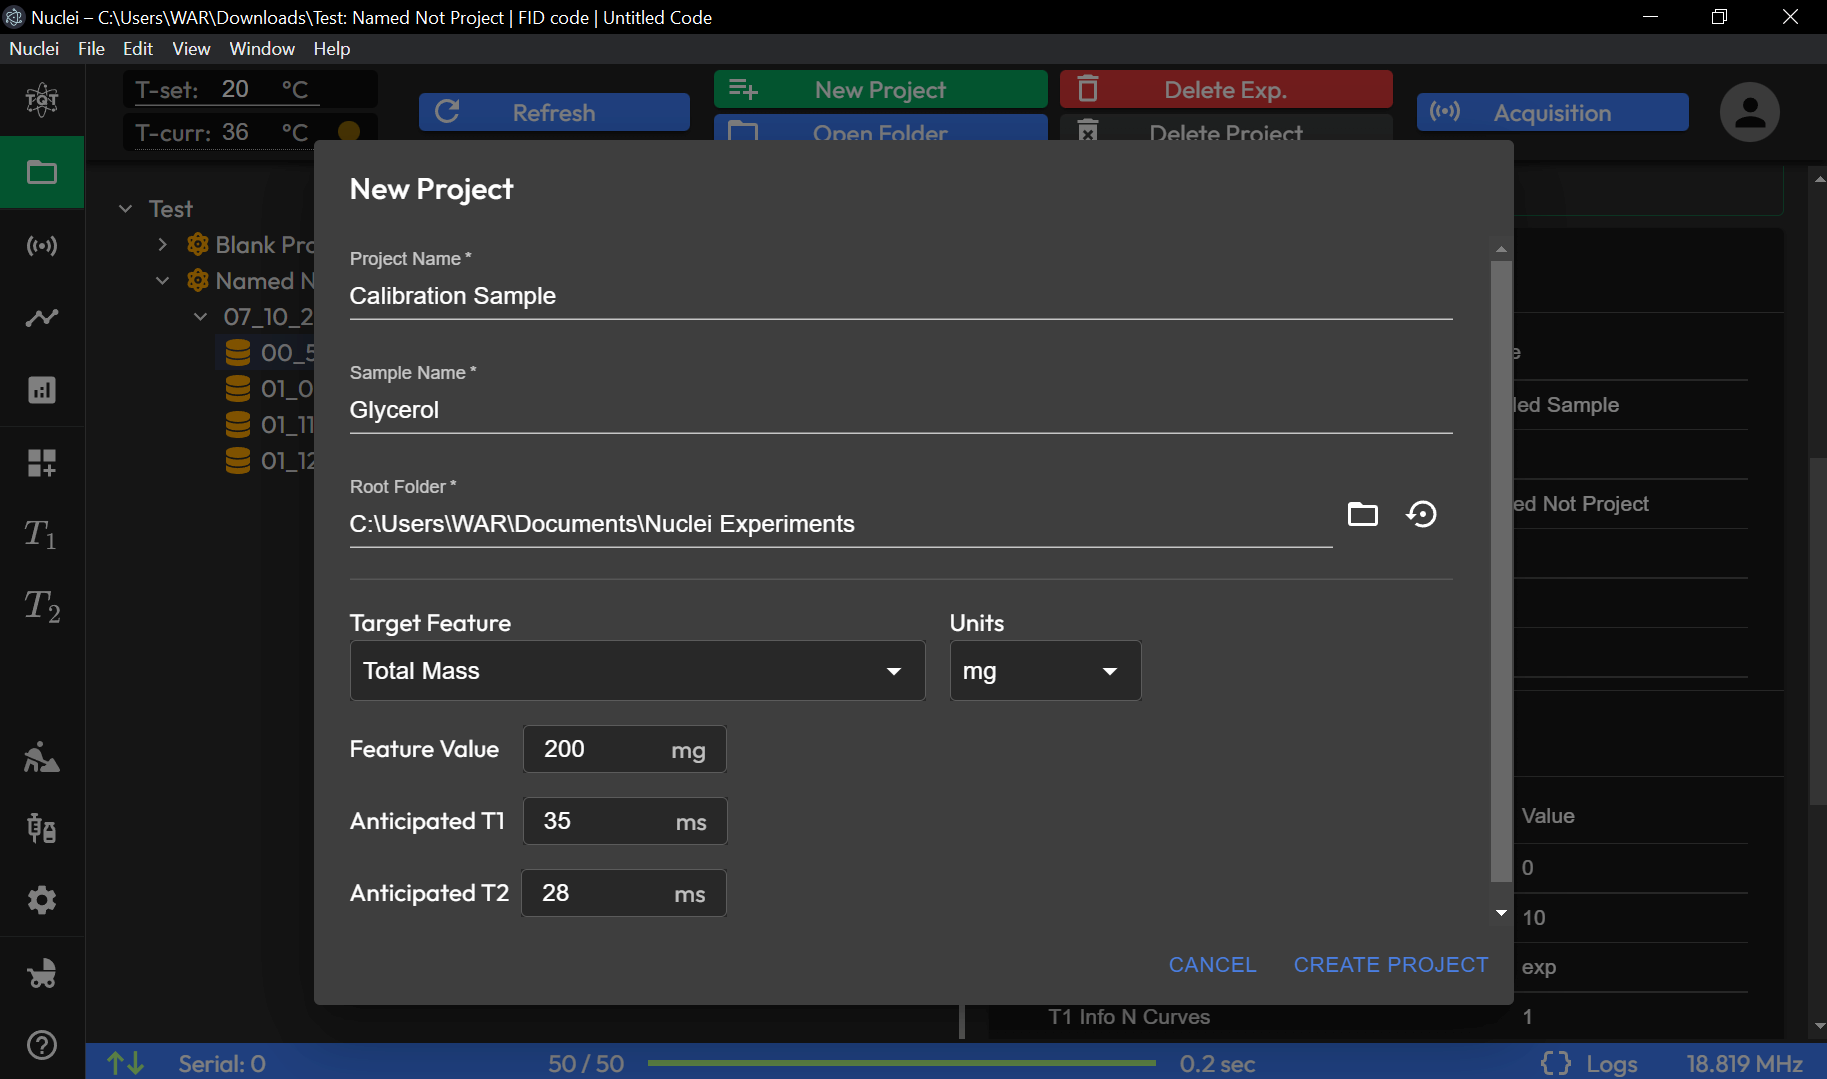
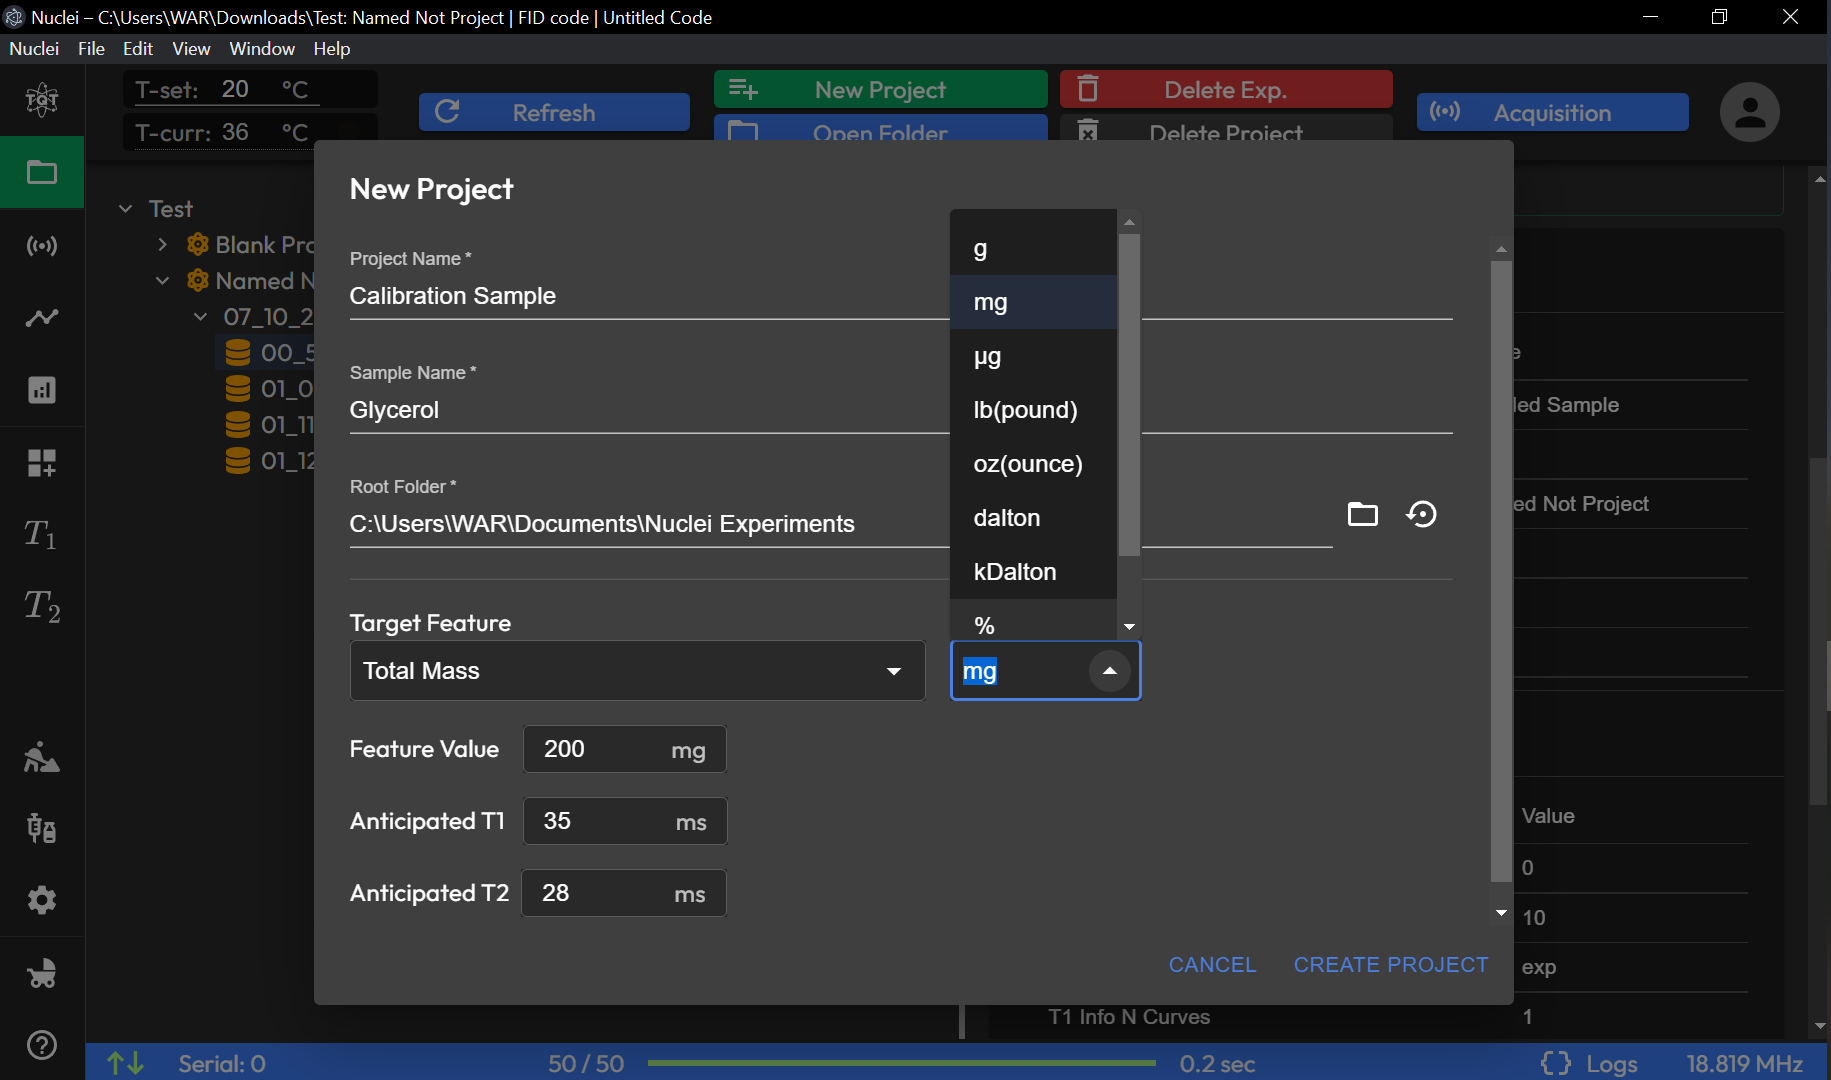
New Project
The New Project dialog allows you to create a new project and configure its initial parameters.
Project Information
Project Name: Enter a unique name for the project. This is a required field.
Sample Name: Specify the name of the sample used in the project. This field is mandatory.
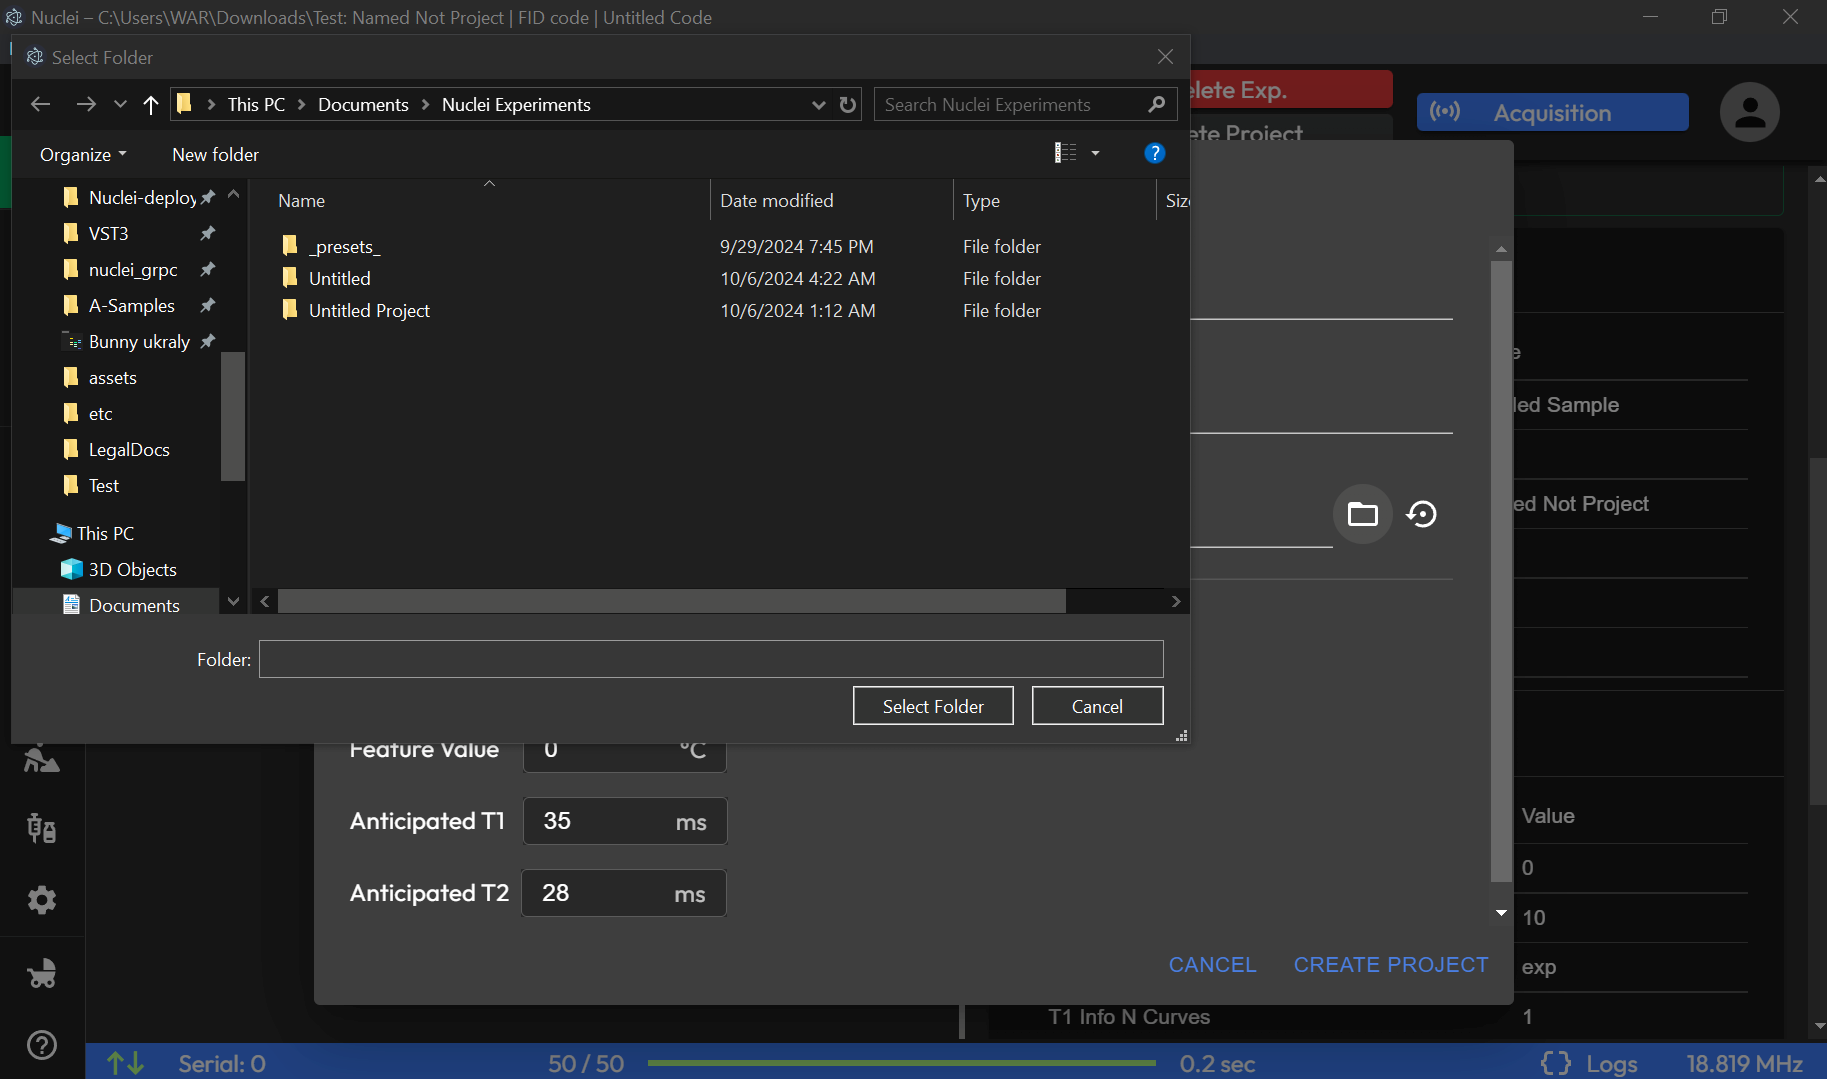
Directory Settings
Root Folder: Define the root folder where project files will be stored. You can select a folder path or reset it to the default.
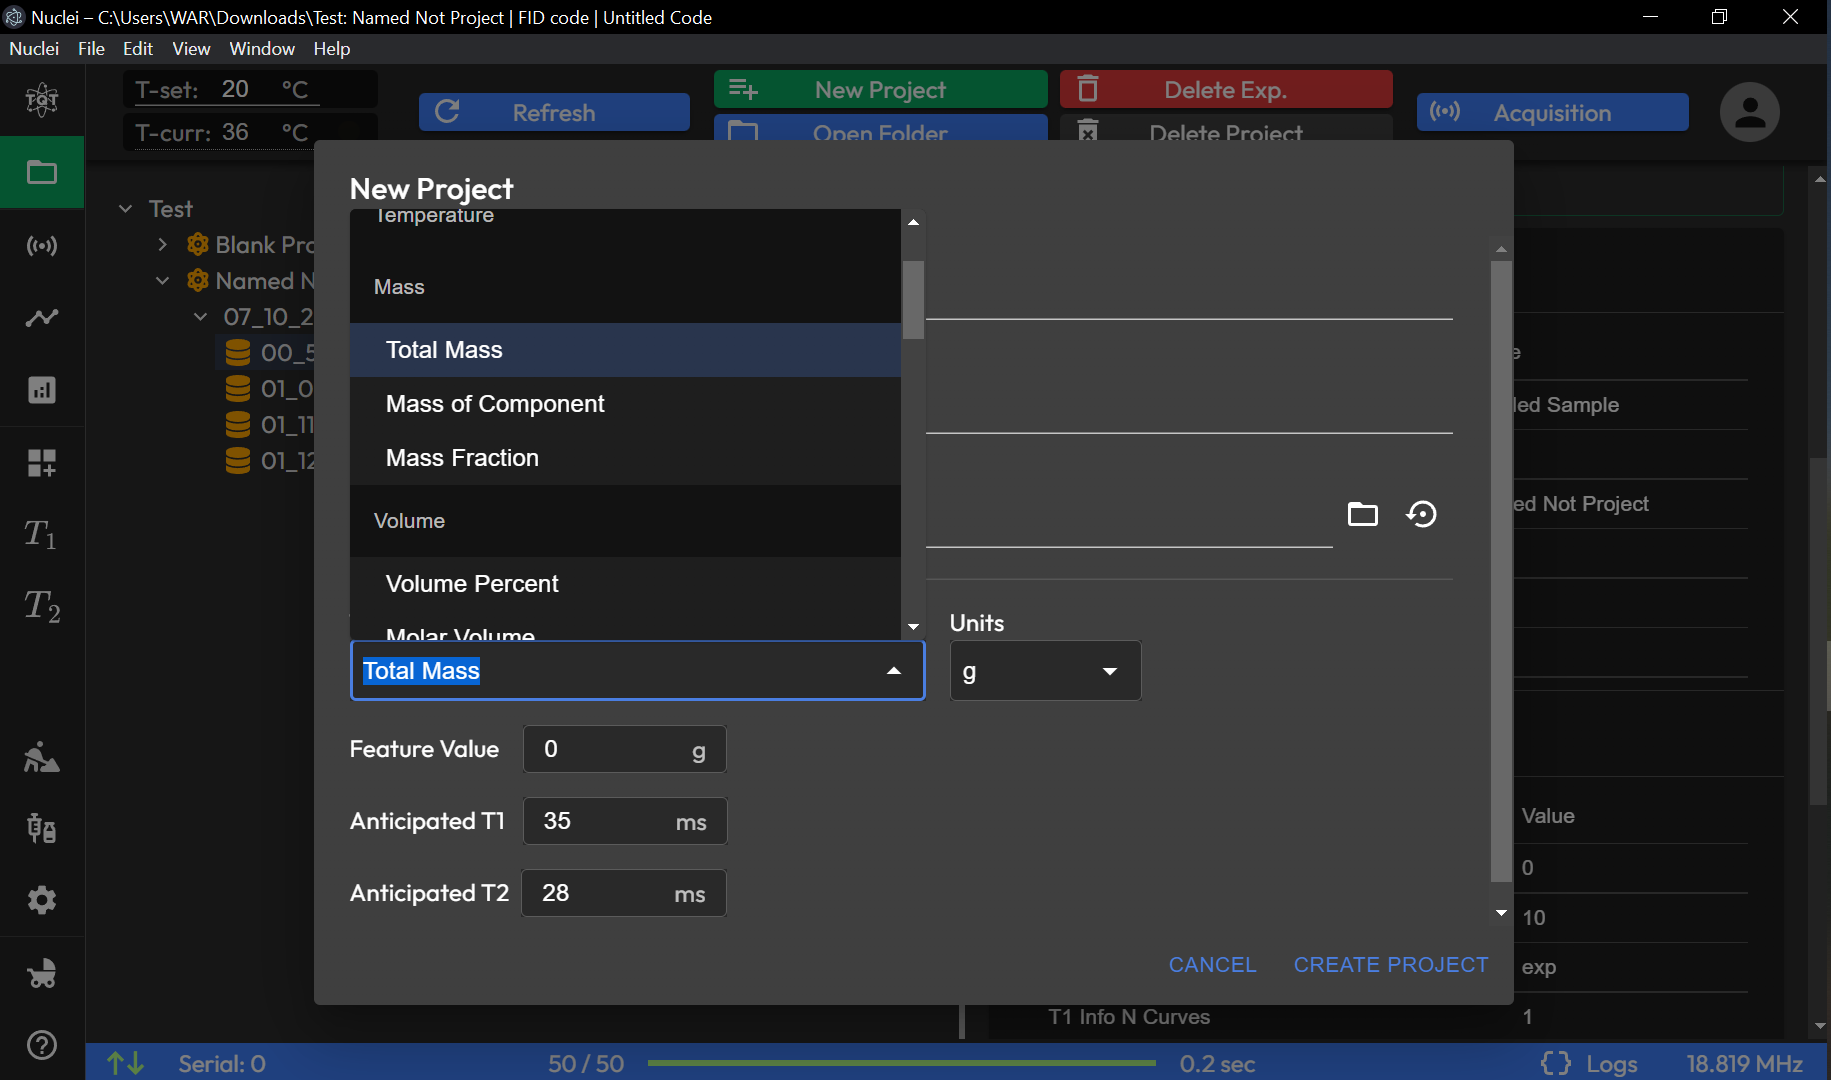
Target Feature Settings
Target Feature: Choose a target feature for the experiment from the dropdown menu. Options may include parameters like Empirical Temperature.
Feature Configuration
Feature Value: Set the initial value for the selected target feature. The unit for the feature value can be adjusted in the Units dropdown.
Units: Choose from °C (Celsius), K (Kelvin), or °F (Fahrenheit).
Anticipated Time Settings
Anticipated T1: Enter the anticipated T1 (relaxation time) in milliseconds (ms).
Anticipated T2: Enter the anticipated T2 (relaxation time) in milliseconds (ms).